Linear Regression, Maths behind it and Best Reason for using least squares

 Linear Regression

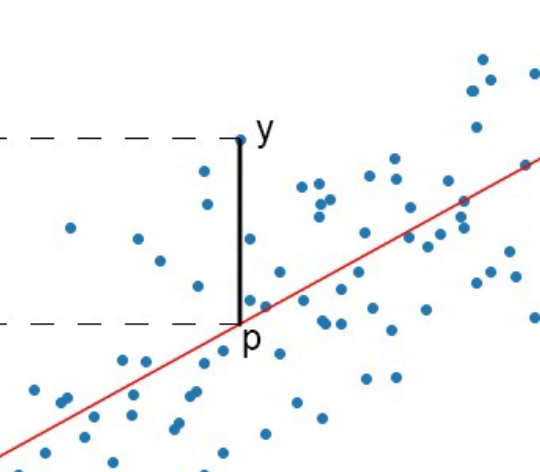
Linear Regression is quite a way that will attempt to fit a line through observed variables (x,y). If we look into the graphs it will try to find the line which is more touching to the point (x^i,y^i) for all I in the dataset, y as a linear function of x and it will seem like

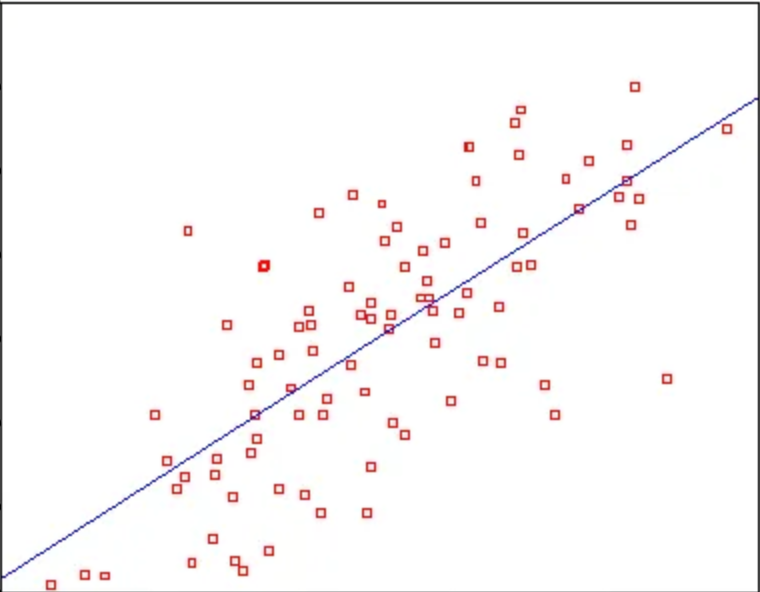
Image for post

As it will try to prophesy a line most possible it will do by the least-squares method which is going to decrease the squares of the distance from the line for all the points.

Catholic rule of Least Squares

As the method will try to find the line Y = MX+ b and for solving it by math just find the distance from the line by putting the point in the equation and all the distances and just minimize it by taking derivative and assigning it to the zero. The general equation looks like

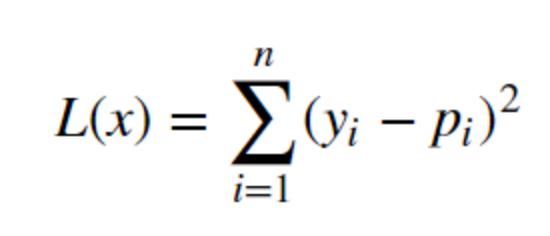
Image for post

and to view it on the graph it will look like

Image for post

Why we use least squares

One purpose is that the equations required in solving for the best-fit line are easy to solve. The only satisfying reason for using it will be proved by the gauss theorem which states

Suppose y=f(x). We measure values x^i,y^i and compute errors y^i-f(x^i). If these errors are independent and normally distributed, then consider, for any possible linear function f the probability P^f​ of getting the measurements (x^i​,y^i​) if y=f(x) were the correct model. The least-squares line is the line for which P^f​ is maximized.

This is the only best reason why we used it over the other methods.

Future Readings

  • Björck, Å. (1996). Numerical Methods for Least Squares Problems. SIAM.
  • Kariya, T.; Kurata, H. (2004). Generalized Least Squares. Hoboken

I hope this helps you in understanding you, linear regression easy way.

Comments

Popular posts from this blog

DBSCAN Clustering Algorithm-with maths

  DBSCAN is a short-form of   D ensity- B ased   S patial   C lustering of   A pplications with   N oise. It is an unsupervised algorithm that will take the set of points and make them into some sets which have the same properties. It is based on the density-based clustering and it will mark the outliers also which do not lie in any of the cluster or set. There are some terms that we need to know before we proceed further for algorithm: Density Reachability A point “p” is said to be   density reachable from a point “q” if point “p” is within ε distance from point “q” and “q” has a sufficient number of points in its neighbors which are within distance ε. Density Connectivity A point “p” and “q” are said to be density connected if there exists a point “r” which has a sufficient number of points in its neighbors and both the points “p” and “q” is within the ε distance. This is a chaining process. So, if “q” is neighbor of “r”, “r” is neighbor of “s”, “s” ...

Airflow for Beginners — II

  As in the previous article   Airflow for beginners — I   we learn about the airflow and how to install the airflow on local. In this article, we will learn about the DAG and how to use the web airflow for scheduling the work and managing it. Let’s start with the DAG and then we will learn about the web airflow. DAG (Directed Acyclic Graph) DAG is a directed graph without a cycle in it. It has a finite number of edges and nodes. In which we can know which thing(node) will come first and we will know the sequence of the nodes. so just think as each node is a work( that you want to execute ) so we can represent the sequencing of the work by the DAG and that’s why DAG is an essential part of the airflow. WEB AIRFLOW So now as you saw that on localhost:8080 if you open it will look like: now, these are the example DAG or work that is added already so for adding your own script(DAG) just follow simple steps mentioned below: Just go to the airflow directory in terminal (it wil...

How to be a HERO in Machine Learning/Data Science Competitions

At present to master machine learning models one has to participate in the competition which is appearing in various platforms. So how somebody who is new to ml can become a  hero  from  zero . The guideline is in this article. The idea for this is not too hard. Just patience and some hard work are required. I will take an example of a Competition that is just finished within top 10. So the competition generally gives you the problem in which some of the features are hidden because they want you to  explore the data  and come up with the feature that explains the target value. By exploring I mean to say the few things: Look at the data. Get the sense of the data. Find the correlation of all features with a target value. Try new features made up of existing features. Exploration needs some  cleaning of the data  also. Because in general, the host will add the noise into the data so that it becomes a trouble for us to achieve good accuracy. By cleaning I...