
Logistic Regression, Maths behind it and where to use it


Image for post

Logistic Regression:

Logistic regression is a classification algorithm used to determine the values for the discrete classes. Unlike the linear regression which usually outputs the continuous value, the logistic regression uses sigmoid function and it will output the probability which will then mapped to the two or more classes.

There can be two types of logistic regression possible which are:

  1. Binary: (having two classes)
  2. Multi-variable: (having more than two)

First of all, let us understand the binary logistic regression and then it will be too easy to grasp what is multi-variable logistic regression.

Binary Logistic Regression:

As notified that name binary, so we will trade with the two classes primarily, we will just determine the probabilities and based upon some rule we will determine which class it belongs to mostly we will do like if p(x) > 0.5 then 1st class else 0th class. So we will decide the class like this simply. For predicting the probability we will use sigmoid function in the logistic regression which looks like

Image for post
Image for post
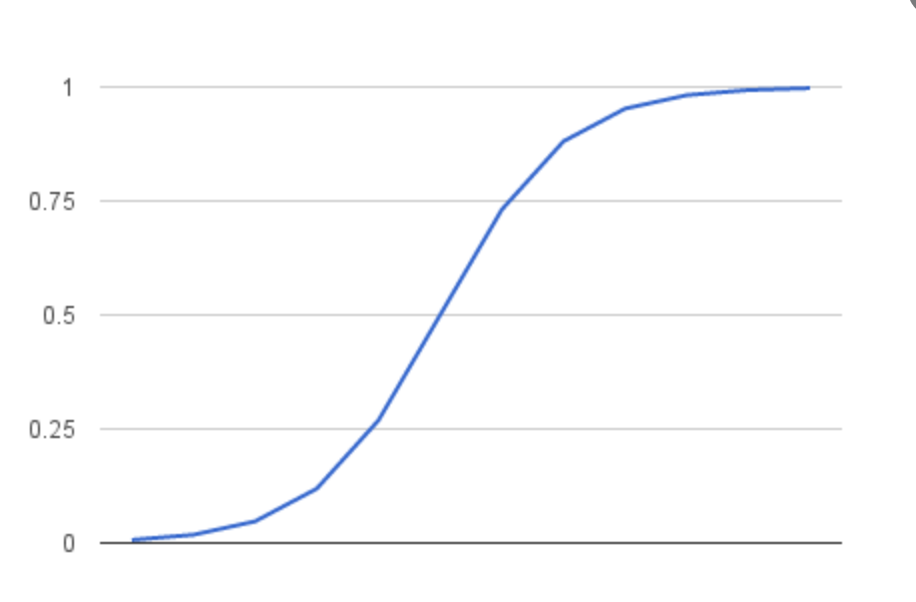
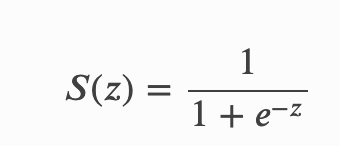
  • s(z) = output between 0 and 1 (probability estimate)
  • z = input to the function (your algorithm’s prediction e.g. MX + b)
  • e = base of natural log

Multiclass Logistic regression:

Instead of only two classes, we will extend our boundary so that now we have n classes from 0 to n-1 Essentially we run binary classification multiple times, once for each class.

Method:

  • Divide the problem into n binary classification problems
  • For each class…
  • Predict the probability.
  • prediction = <math>max(probability of the classes

For each sub-problem, we select one class and lump all the others into a second class. Then we take the class with the highest predicted value.

Future Learning:

  1. Tolles, Juliana; Meurer, William J (2016). “Logistic Regression Relating Patient Characteristics to Outcomes”.
  2. Walker, SH; Duncan, DB (1967). “Estimation of the probability of an event as a function of several independent variables”.

Comments

Popular posts from this blog

How to be a HERO in Machine Learning/Data Science Competitions

At present to master machine learning models one has to participate in the competition which is appearing in various platforms. So how somebody who is new to ml can become a  hero  from  zero . The guideline is in this article. The idea for this is not too hard. Just patience and some hard work are required. I will take an example of a Competition that is just finished within top 10. So the competition generally gives you the problem in which some of the features are hidden because they want you to  explore the data  and come up with the feature that explains the target value. By exploring I mean to say the few things: Look at the data. Get the sense of the data. Find the correlation of all features with a target value. Try new features made up of existing features. Exploration needs some  cleaning of the data  also. Because in general, the host will add the noise into the data so that it becomes a trouble for us to achieve good accuracy. By cleaning I...

Random Forest and how it works

  Random Forest Random Forest is a Machine Learning Algorithm based on Decision Trees. Random forest works on the ensemble method which is very common these days. The ensemble method means that to make a decision collectively based on the decision trees. Actually, we make a prediction, not simply based on One Decision Tree, but by an unanimous Prediction, made by ‘ K’  Decision Trees. Why should we use There are four reasons why should we us e  the random forest algorithm. The one is that it can be used for both  classification and regression  businesses. Overfitting is one critical problem that may make the results worse, but for the Random Forest algorithm, if there are enough trees in the forest, the classifier  won’t overfit  the model. The third reason is the classifier of Random Forest can handle  missing values , and the last advantage is that the Random Forest classifier can be modeled for  categorical values. How does the Random...

DBSCAN Clustering Algorithm-with maths

  DBSCAN is a short-form of   D ensity- B ased   S patial   C lustering of   A pplications with   N oise. It is an unsupervised algorithm that will take the set of points and make them into some sets which have the same properties. It is based on the density-based clustering and it will mark the outliers also which do not lie in any of the cluster or set. There are some terms that we need to know before we proceed further for algorithm: Density Reachability A point “p” is said to be   density reachable from a point “q” if point “p” is within ε distance from point “q” and “q” has a sufficient number of points in its neighbors which are within distance ε. Density Connectivity A point “p” and “q” are said to be density connected if there exists a point “r” which has a sufficient number of points in its neighbors and both the points “p” and “q” is within the ε distance. This is a chaining process. So, if “q” is neighbor of “r”, “r” is neighbor of “s”, “s” ...